Detroit, Tampa, Indianapolis Named North America’s Top 3 Airports
JD Power's annual rankings of North America's best airports have been released, with Detroit Metropolitan being named the best one handling over 300 million passengers per year
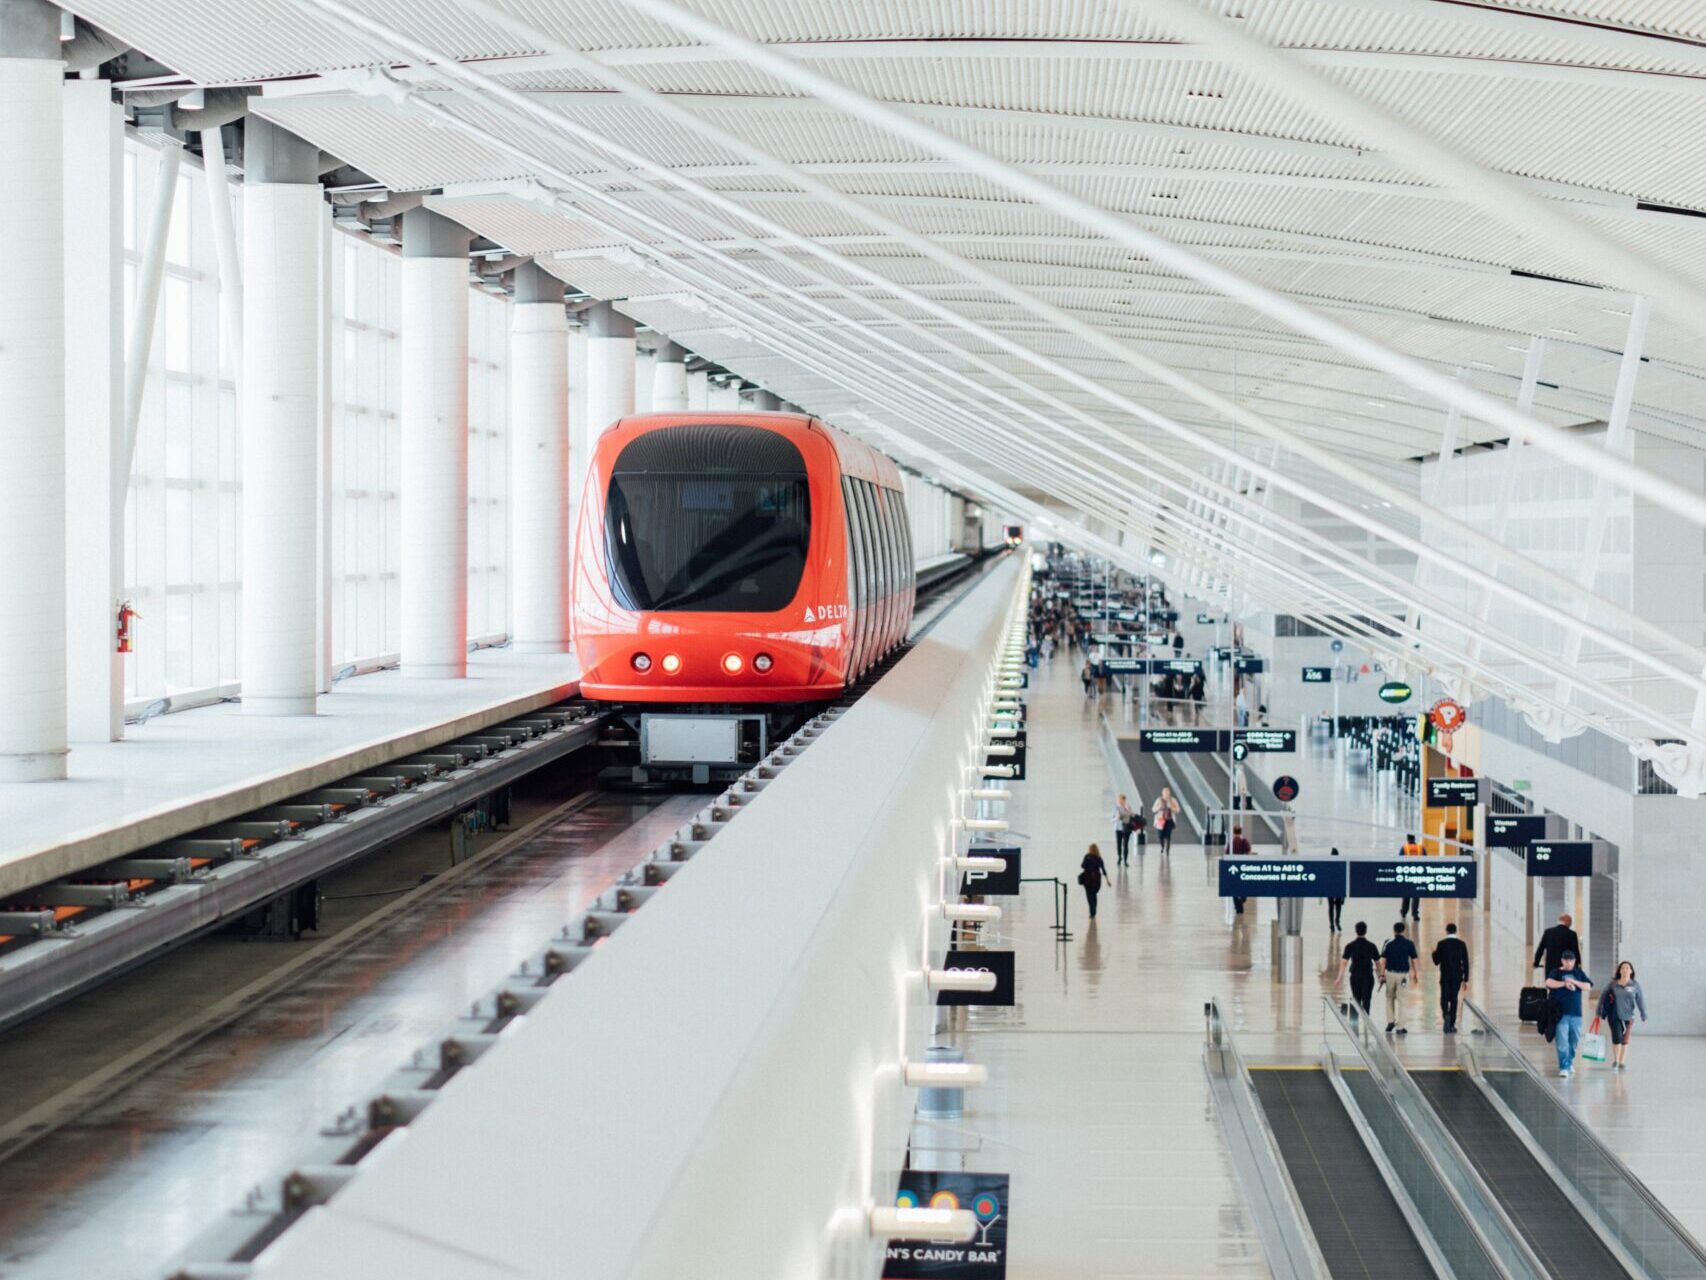
Photo: Detroit International Airport. Courtesy of Hanson-Lu / Unsplash
Air travel can be hectic and exhausting, but travelers lucky enough to pass through Detroit, Tampa, and Indianapolis have smoother journeys. J.D. Power has named those city’s airports its top three for customer satisfaction this year.
The market research firm published its annual North American Airport Satisfaction Study this week, polling passengers about their experience and ranking the continent’s airports on their performance.
The rankings considered six metrics: terminal facilities, arrival and departure, baggage claim, security check, check-in and baggage check, and food, beverage, and retail services.
Detroit on Top
Among mega airports that handle over 33 million passengers a year, Detroit Metropolitan Wayne County Airport (DTW) performed the best, scoring 800.
The Michigan airport, a major hub for Delta and its SkyTeam partners, pushed last year’s top mega airport, Minneapolis-St. Paul International Airport (MSP), to second place. Las Vegas’ Harry Reid International Airport (LAS) rounded out the top three mega airports.

Photo: Detroit Airport’s Connecting Tunnel. Courtesy of Augusto Navarro / Unsplash
On the other end of the spectrum, Newark Liberty International Airport (EWR), Toronto Pearson International Airport (YYZ), and Seattle Tacoma International Airport (SEA) were the worst-performing mega airports.
Tampa Is Leading Its Category
For the second year running, Tampa International Airport (TPA) posted the best score among large airports (those that see 10 to 32.9 million passengers a year). It was joined by John Wayne Airport (SNA) in Orange County, California, and Salt Lake City International Airport (SLC) in the top three.
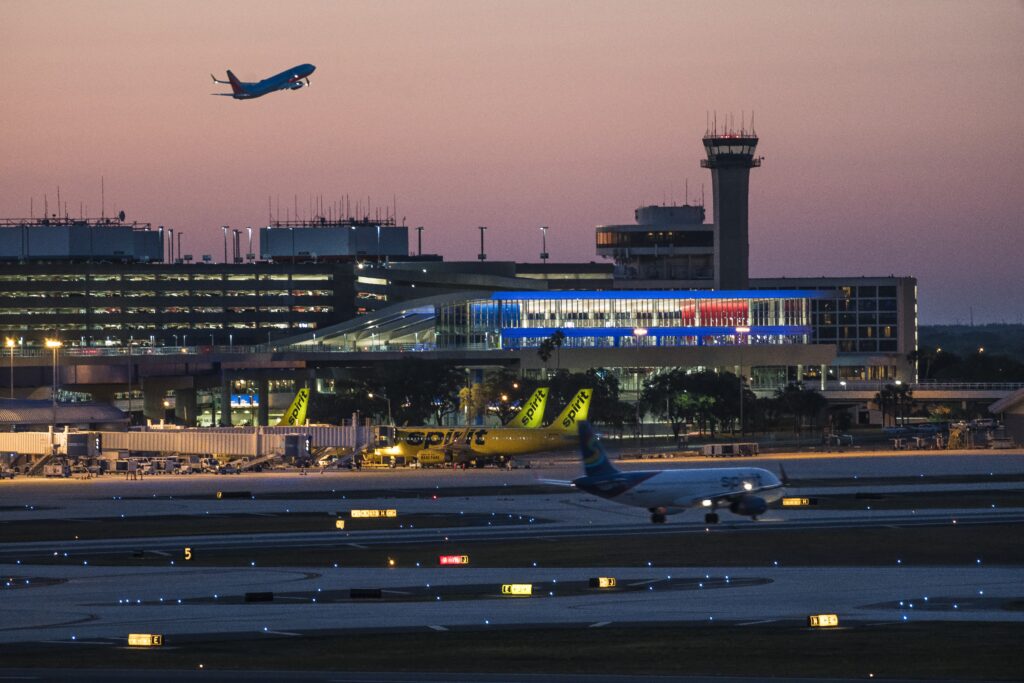
Photo: Courtesy of Tampa International Airport
Indianapolis International Airport (IND) held the top position in the medium airports category (those receiving between 4.5 and 9.9 million passengers annually). It racked up the best score of any airport, 843 out of 1,000.
Southwest Florida International Airport (RSW), located near Fort Myers, and Ontario International Airport (ONT), in San Bernardino, California, were awarded second and third place, respectively.
Philadelphia at the Bottom
Philadelphia International Airport (PHL) was the worst-performing large airport, while Kahului Airport (OGG) in Maui, Hawaii, scored the lowest among medium airports.
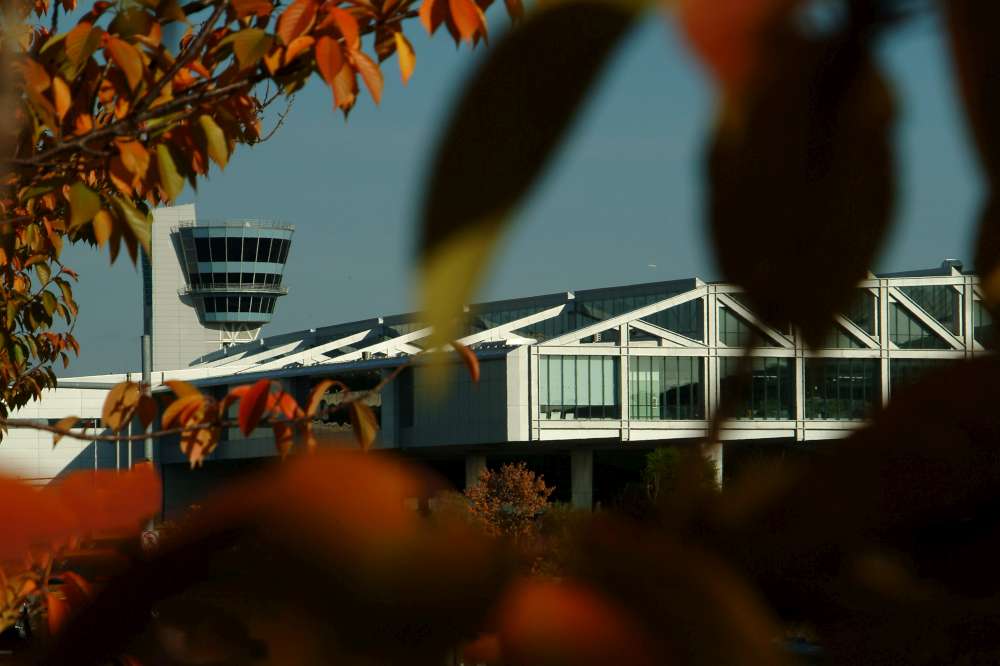
Photo: Courtesy of Philadelphia International Airport
Overall, traveler satisfaction with airports increased in 2023 despite ongoing turbulence as the industry recovered from its pandemic shutdown and coped with crowding, staff shortages, and bad winter weather.
In particular, passengers reported greater satisfaction with airport terminals, baggage claims, and food, beverage, and retail services.
“It has not been an easy year for North American airports, but major capital improvements they’ve made over the last several years and new investments in getting food, beverage, and retail operations back up and running at full capacity have helped them manage the crush of passengers,” Michael Taylor, J.D. Power’s managing director of travel, hospitality, and retail, said in a statement.
Photo: The new terminal opening at LaGuardia International Airport on Monday, May 30, 2022. Courtesy of Delta Air Lines / Chris Rank, Rank Studios
For example, New York’s LaGuardia Airport (LGA) has dramatically reversed its fortunes with a $4 billion renovation of its terminals. Once slated by then-Vice President Joe Biden and ranked dead last among large airports by J.D. Power in 2019, it’s now comfortably in the middle of the pack.
Better airport performance isn’t just about easing travel stress: less harried visitors spend significantly more at airports. J.D. Power found that passengers reporting higher satisfaction shelled out $44 during their visit, compared to $29 among those reporting lower scores.
But J.D. Power warned airports that crowding in terminals and lounges could erode that satisfaction. About 60% of the passengers it surveyed said they’ve encountered severe or moderate overcrowding at an airport terminal, up two percentage points since 2022.
“Happy passengers spend a lot more money at the airport, so ongoing efforts to spread passenger volumes throughout the day and deliver superior service at all customer touchpoints will be critical,” Taylor said.
Ranking Mega Airports
Rank Airport Score (out of 1,000)
- Detroit Metropolitan Wayne County (DTW) 800
- Minneapolis-St. Paul International (MSP) 796
- Las Vegas Harry Reid International (LAS) 787
- Dallas Fort Worth International (DFW) 783
- Miami International (MIA) 783
- San Francisco International (SFO) 781
- Denver International (DEN) 777
- Hartsfield-Jackson Atlanta International (ATL) 777
- Orlando International (MCO) 777
- New York John F. Kennedy International (JFK) 773
- Charlotte Douglas International (CLT) 772
- Phoenix Sky Harbor International (PHX) 769
- Los Angeles International (LAX) 765
- Chicago O’Hare International (ORD) 763
- Boston Logan International (BOS) 762
- Fort Lauderdale-Hollywood International (FLL) 762
- Seattle-Tacoma International (SEA) 754
- Toronto Pearson (YYZ) 749
- Newark Liberty International (EWR) 732
Ranking Large Airports
- Tampa International (TPA) 832
- Santa Ana John Wayne (SNA) 829
- Salt Lake City International (SLC) 825
- Dallas Love Field (DAL) 820
- Raleigh-Durham International (RDU) 813
- Sacramento International (SMF) 806
- Houston William P. Hobby (HOU) 806
- Louis Armstrong New Orleans International (MSY) 804
- San Antonio International (SAT) 802
- Calgary International (YYC) 801
- Nashville International (BNA) 799
- Portland International (PDX) 797
- Kansas City International (MCI) 788
- New York LaGuardia (LGA) 788
- Baltimore/Washington International Thurgood Marshall (BWI) 787
- Vancouver International (YVR) 787
- Washington Dulles International (IAD) 784
- Austin-Bergstrom International (AUS) 783
- Chicago Midway International (MDW) 780
- Ronald Reagan Washington National (DCA) 779
- Norman Y. Mineta San Jose International (SJC) 776
- St. Louis Lambert International (STL) 775
- San Diego International (SAN) 772
- Oakland International (OAK) 768
- Montreal-Trudeau International (YUL) 759
- Honolulu Daniel K. Inouye International (HNL) 753
- Philadelphia International (PHL) 750
Ranking Medium Airports
- Indianapolis International (IND) 843
- Southwest Florida International (RSW) 839
- Ontario International (ONT) 834
- Palm Beach International (PBI) 828
- Albuquerque International Sunport (ABQ) 827
- Jacksonville International (JAX) 821
- Cincinnati/Northern Kentucky International (CVG) 817
- Buffalo Niagara International (BUF) 813
- Milwaukee Mitchell International (MKE) 811
- Pittsburgh International (PIT) 811
- John Glenn Columbus International (CMH) 807
- Omaha Eppley Airfield (OMA) 804
- Cleveland Hopkins International (CLE) 794
- Connecticut Bradley International (BDL) 789
- Hollywood Burbank (BUR) 772
- Kahului (OGG) 771